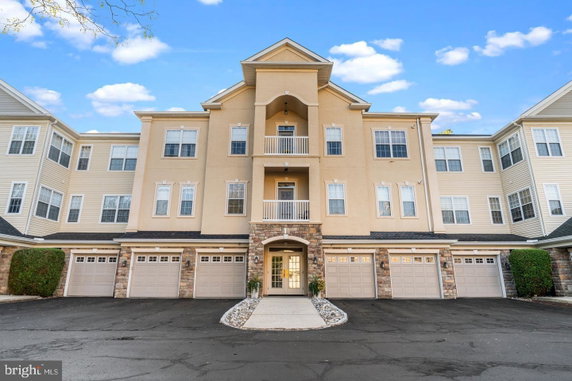
High availability buildings list units frequently.
Unit Availability helps to understand how often units in a particular building are listed for sale as compared with the neighborhood average. Units are rarely listed in buildings with low availability.
Unit Demand
-
Units in high-demand buildings sell quicker.
Unit Demand is a measure of quickly units in a particular building sell as compared with other buildings in the neighborhood. Units in high-demand buildings sell more quickly.
This neighborhood indicates a good mix of people which makes it a good place for families. About 11.74% are children aged 0–14, 17.37% are young adults between 15–29, 17.09% are adults aged 30–44, 18.56% are in the 45–59 range and 35.24% are seniors aged 60 and above.
Commuting options are also varying where 86.35% of residents relying on driving, while others prefer public transit around 4.19%, walking around 0.4%, biking around 0%, allowing residents to choose travel modes that best fit their daily routines.
Most homes in the area are with 88.02% of units owner occupied and 11.98% are rented.
The neighborhood offers different household types. About 33.2% are single family homes and 7.85% are multi family units. Around 23.66% are single-person households, while 76.34% are multi person households. This mix works well for families, roommates, and individuals.
Education levels in the neighborhood vary widely where 20.81% of residents have bachelor’s degrees. Around 30.68% have high school or college education. Another 11.25% hold diplomas while 13.53% have completed postgraduate studies. The remaining are 23.73% with other types of qualifications.
Demographics Description
This neighborhood indicates a good mix of people which makes it a good place for families. About 11.74% are children aged 0–14, 17.37% are young adults between 15–29, 17.09% are adults aged 30–44, 18.56% are in the 45–59 range and 35.24% are seniors aged 60 and above.
Commuting options are also varying where 86.35% of residents relying on driving, while others prefer public transit around 4.19%, walking around 0.4%, biking around 0%, allowing residents to choose travel modes that best fit their daily routines.
Most homes in the area are with 88.02% of units owner occupied and 11.98% are rented.
The neighborhood offers different household types. About 33.2% are single family homes and 7.85% are multi family units. Around 23.66% are single-person households, while 76.34% are multi person households. This mix works well for families, roommates, and individuals.
Education levels in the neighborhood vary widely where 20.81% of residents have bachelor’s degrees. Around 30.68% have high school or college education. Another 11.25% hold diplomas while 13.53% have completed postgraduate studies. The remaining are 23.73% with other types of qualifications.
Age Demographics
11.74%(0 - 14 years old)
17.37%(15 - 29 years old)
17.09%(30 - 44 years old)
18.56%(45 - 59 years old)
35.24%(60+ years old)
Commute
4.19%
Transit
0.4%
Walk
86.35%
Drive
0%
Bike
Housing Ownership
88.02%
Owner Occupied
11.98%
Rental Units
Household Types
33.2%
Single Family
7.85%
Multi Family
23.66%
Single Person
76.34%
Multi Person
Education
Bachelors Degree20.81%
High School College30.68%
Diploma11.25%
Post Graduate13.53%
Others23.73%
Education
Diploma11.25%
Post Graduate13.53%
Others23.73%
Get the HelloCondo Newsletter
Real-estate tips, insights, and market reports in your inbox.
HelloCondo Is The #1 Condo Search Platform And Real Estate Recommendation Engine. Search, Find And Buy The Perfect Condo And Get Matched With The Best Agents. Finding A Condo Has Never Been So Easy.